Dashboard
The Dashboard is your main screen after logging in. It shows the most important information about your finances in one place — without the need to jump between sections.
Quick Statistics
At the very top of the Dashboard, you'll see three key numbers for the current month:
- Income — how much money came in
- Expenses — how much you spent
- Balance — the difference between income and expenses
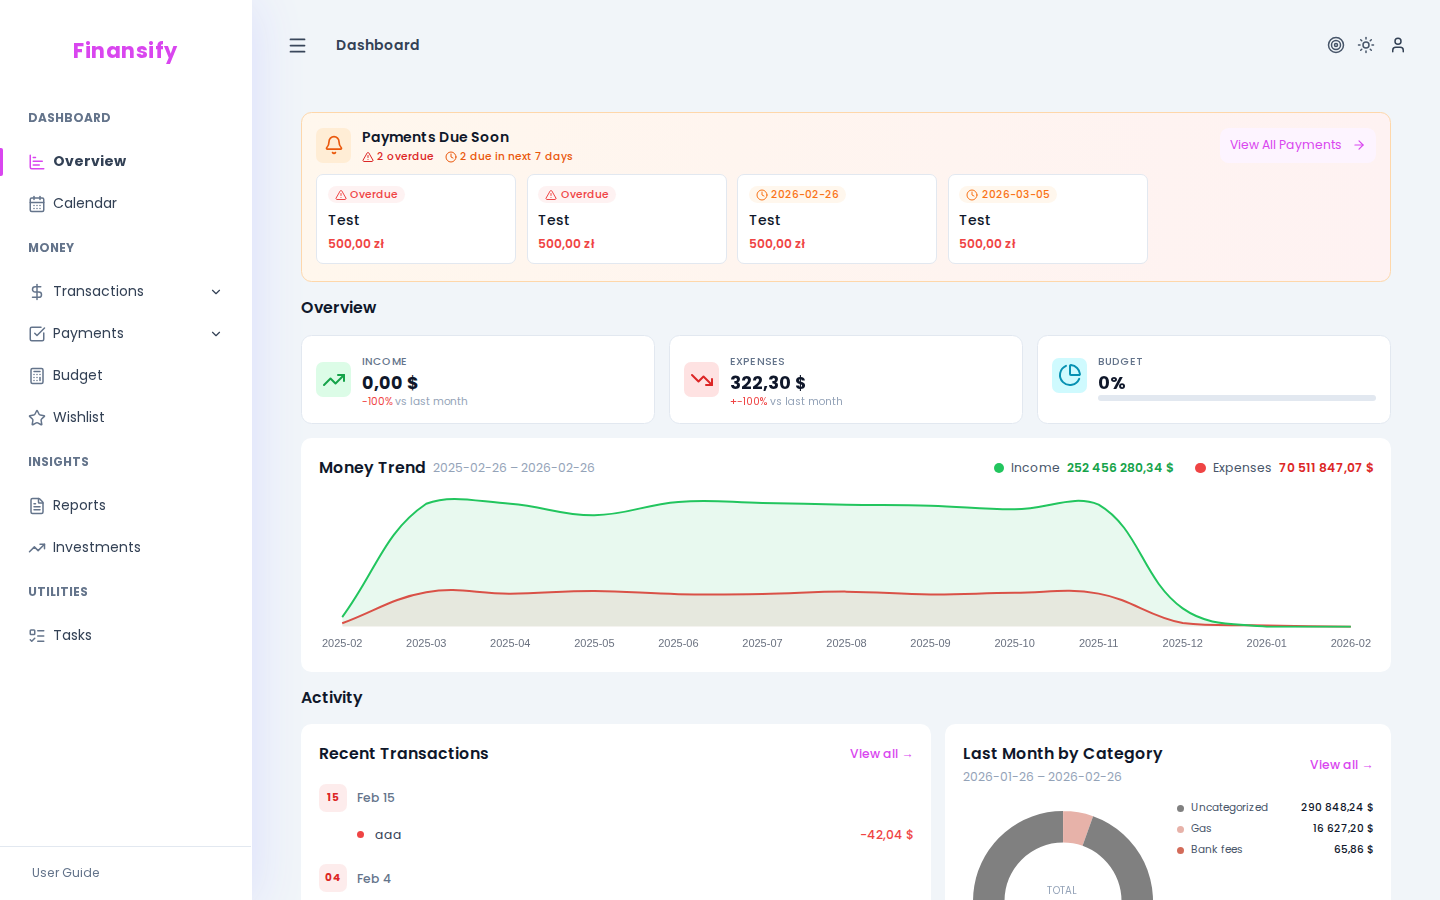 Dashboard — main view
Widgets
The Dashboard is made up of widgets — small sections, each showing a different aspect of your finances.
Financial Overview
The main widget with three tiles:
- Income — total income this month, with a comparison to the previous month (e.g., "+12% vs last month")
- Expenses — total expenses with a similar comparison
- Budget — a progress bar showing how much of your active budget you've already used. If you don't have any budget, you'll see a prompt "Start controlling your spending!"
This widget also contains a receipt upload zone — you can drag and drop a receipt photo directly onto the Dashboard, and Finansify will process it automatically.
 Financial overview widget
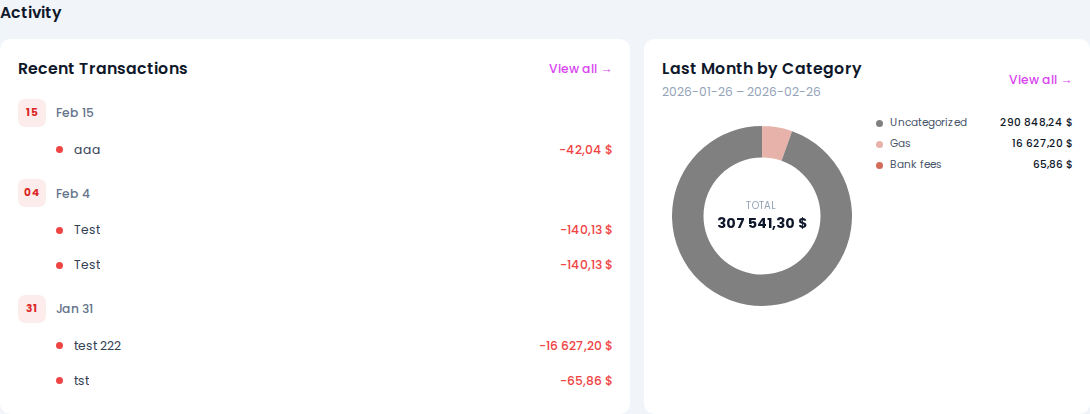
Recent Transactions
A list of your most recent transactions — a quick look at what's been happening in your accounts lately. Each item shows the name, amount (green = income, red = expense), and date.
Clicking on a transaction takes you to its details.
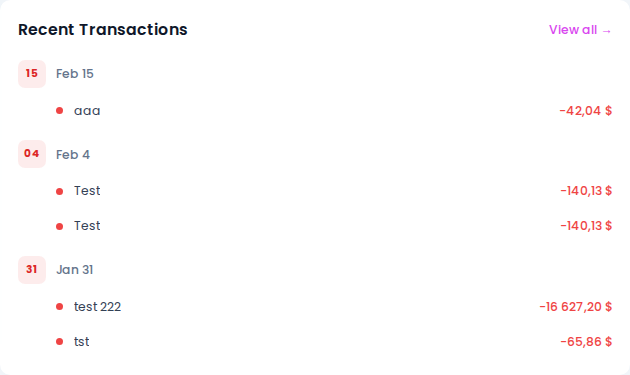 Recent transactions widget
Money Trend
A line chart showing your income and expenses over the past several months. It helps you see how your finances are changing over time.
Advanced mode: This widget is only visible in advanced mode.
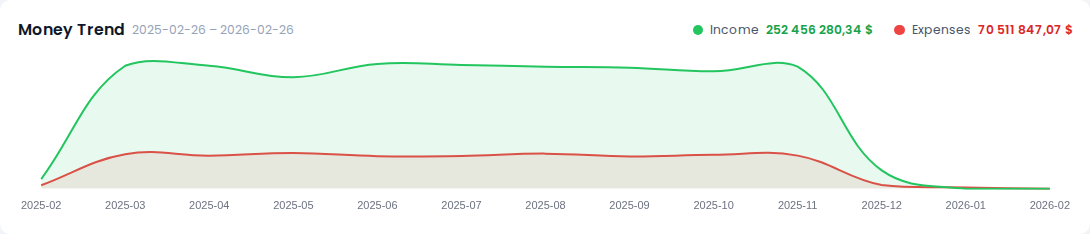 Money trend widget
Last Month's Expenses by Category
A breakdown of last month's expenses by category. It shows exactly what you're spending money on — e.g., "Food: 1,200 PLN", "Transportation: 400 PLN", etc.
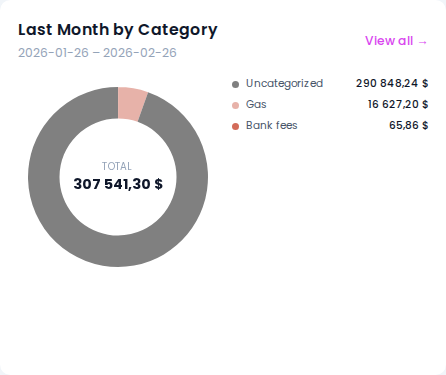 Monthly expenses widget
Upcoming Payments
If you have recurring payments set up, this banner shows payments that are approaching their due date. This way you won't forget about rent, installments, or subscriptions.
Advanced mode: This widget is only visible in advanced mode.
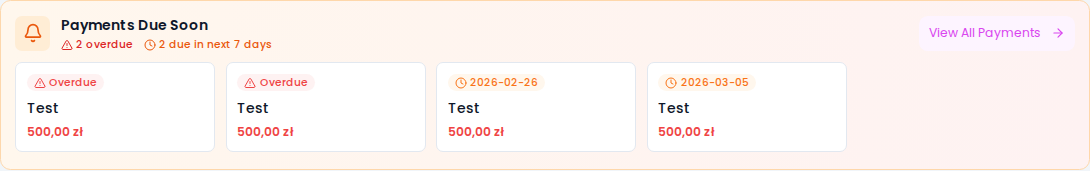 Upcoming payments banner
Recent Activity
A history of your recent actions in the application — e.g., "Created transaction 'Groceries'", "Updated budget 'March'". Useful for remembering what you did recently.
 Recent activity widget
Onboarding on the Dashboard
If you're a new user, you'll see additional elements on the Dashboard:
Onboarding Checklist
A list of 5 steps to complete at the start — from getting to know the app to setting up your first budget. A progress bar shows how much you've already done. You can close it when you don't need it.
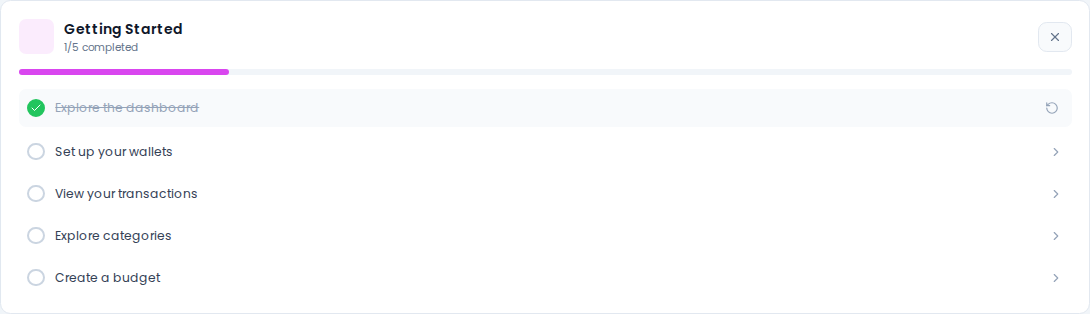 Onboarding checklist
Demo Data Banner
If you enabled demo data in the Welcome Wizard, a banner will appear on the Dashboard informing you that you're browsing sample data. You can remove it at any time.
Tour Resumption
If you paused the interactive tour, you'll see a button allowing you to resume from where you left off.
Simple vs Advanced Mode
The Dashboard displays differently depending on the selected interface mode:
- Simple mode — shows basic widgets: financial overview, recent transactions, monthly expenses
- Advanced mode — adds: money trend, upcoming payments, recent activity, additional statistics
You can change the mode in Settings → Appearance.
See also:
- Transactions — details of transactions visible on the Dashboard
- Budgets — budget visible in the widget
- Recurring Payments — upcoming payments
- Appearance — switching between simple/advanced mode