Reports
Reports are an advanced tool for analyzing your finances. They are based on tags, not categories — which lets you analyze spending "across" categories and wallets. For example: how much it costs you in total to maintain your apartment (rent + utilities + internet + insurance — from different categories).
Premium: The reports module is available exclusively on the Premium plan.
What are tag reports?
Standard categories group transactions vertically: "Food", "Transport", "Entertainment". But what if you want to see all expenses related to a vacation — flight tickets (Transport), hotel (Housing), and restaurants (Food)?
That's exactly what tags and tag reports are for. Tag transactions with a common tag (e.g. "Croatia Vacation") and create a report that shows them all together — regardless of category and wallet.
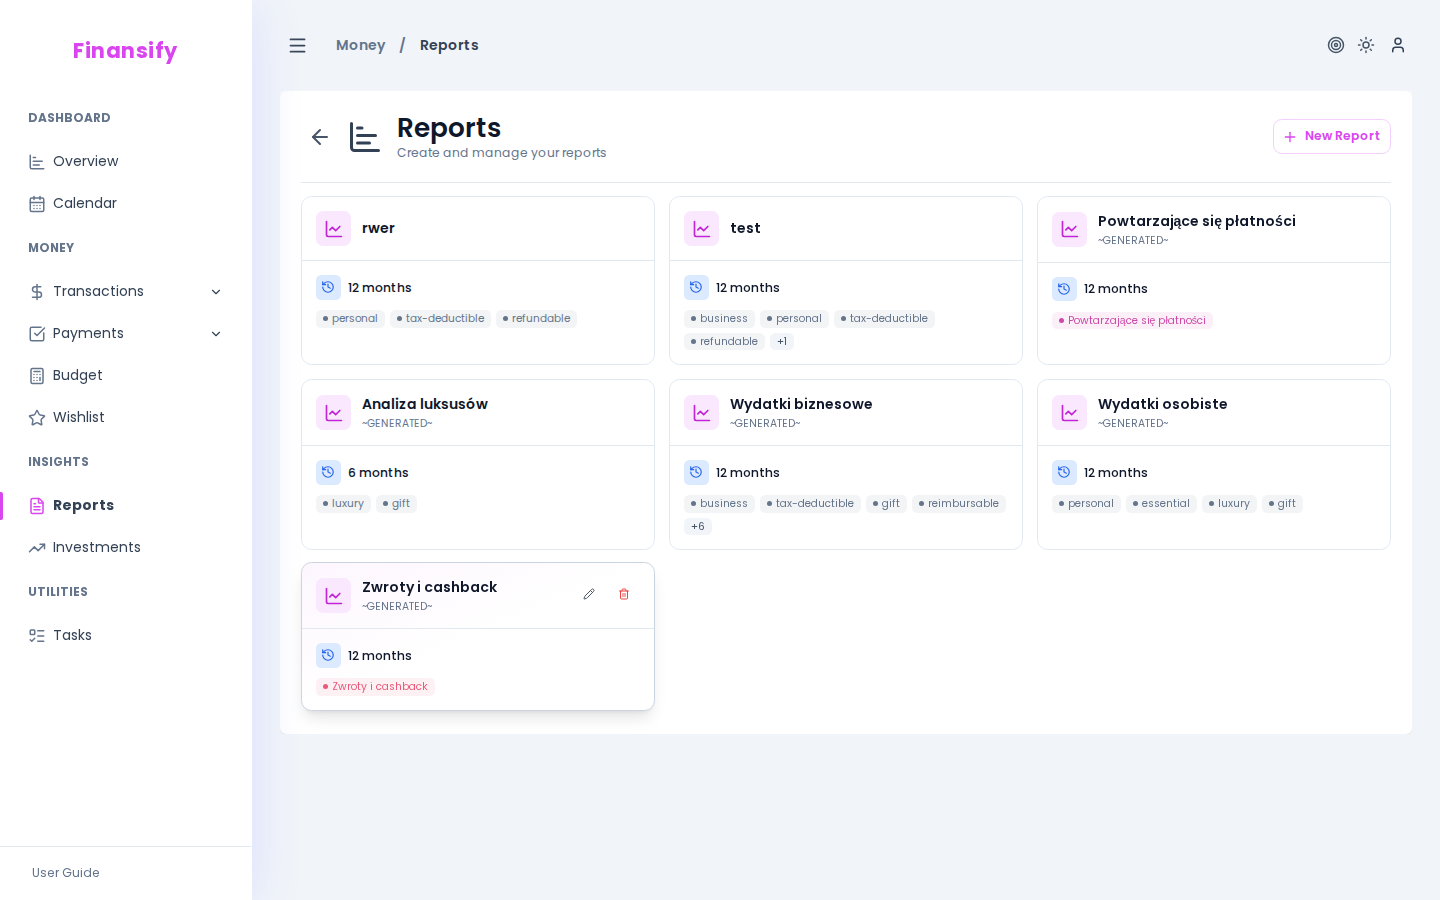
Report list
On the reports page you can see all your saved reports as cards. Each card shows:
- Report name
- Notes
- Analysis period (how many months back)
- Tag groups (as colored chips)
 Report list
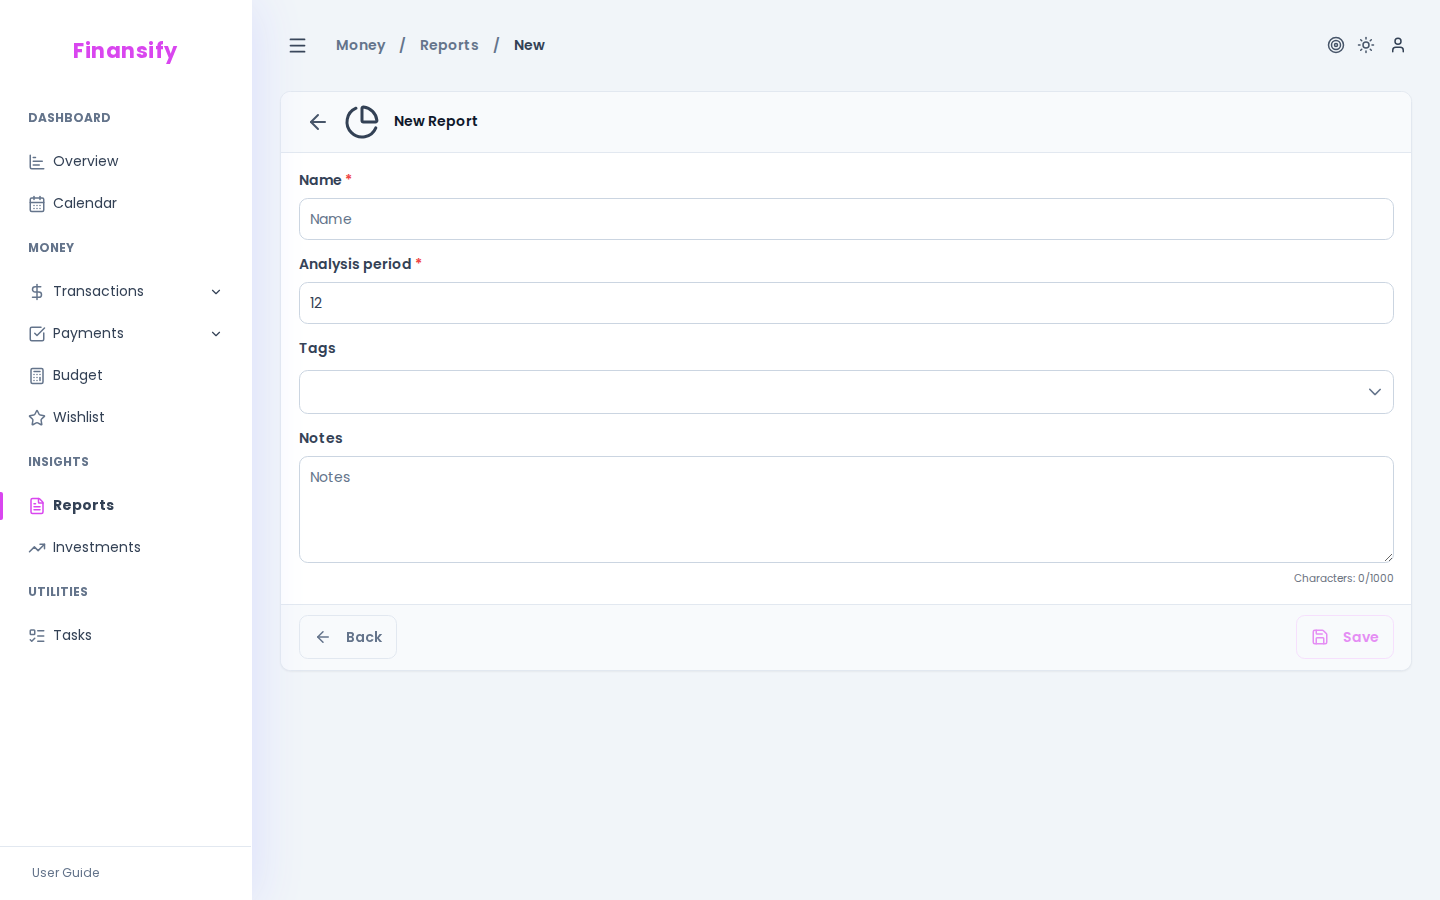
Creating a report
- Click New report
- Fill in the form:
| Field | Description | Required |
|---|---|---|
| Name | E.g. "Housing costs", "Car expenses" | Yes |
| Notes | Additional information | No |
| Period (months back) | How many months back to analyze (1–24, default 12) | Yes |
| Tag groups | Which tags to include in the report | Yes |
Tag groups
This is the key to reports. Each group is a set of tags you want to compare. For example:
- Group "Rent" -> tags:
rent - Group "Utilities" -> tags:
electricity,gas,water - Group "Internet and TV" -> tags:
internet,TV
On the chart each group will be a separate line/bar, allowing you to compare spending between groups.
 Report form
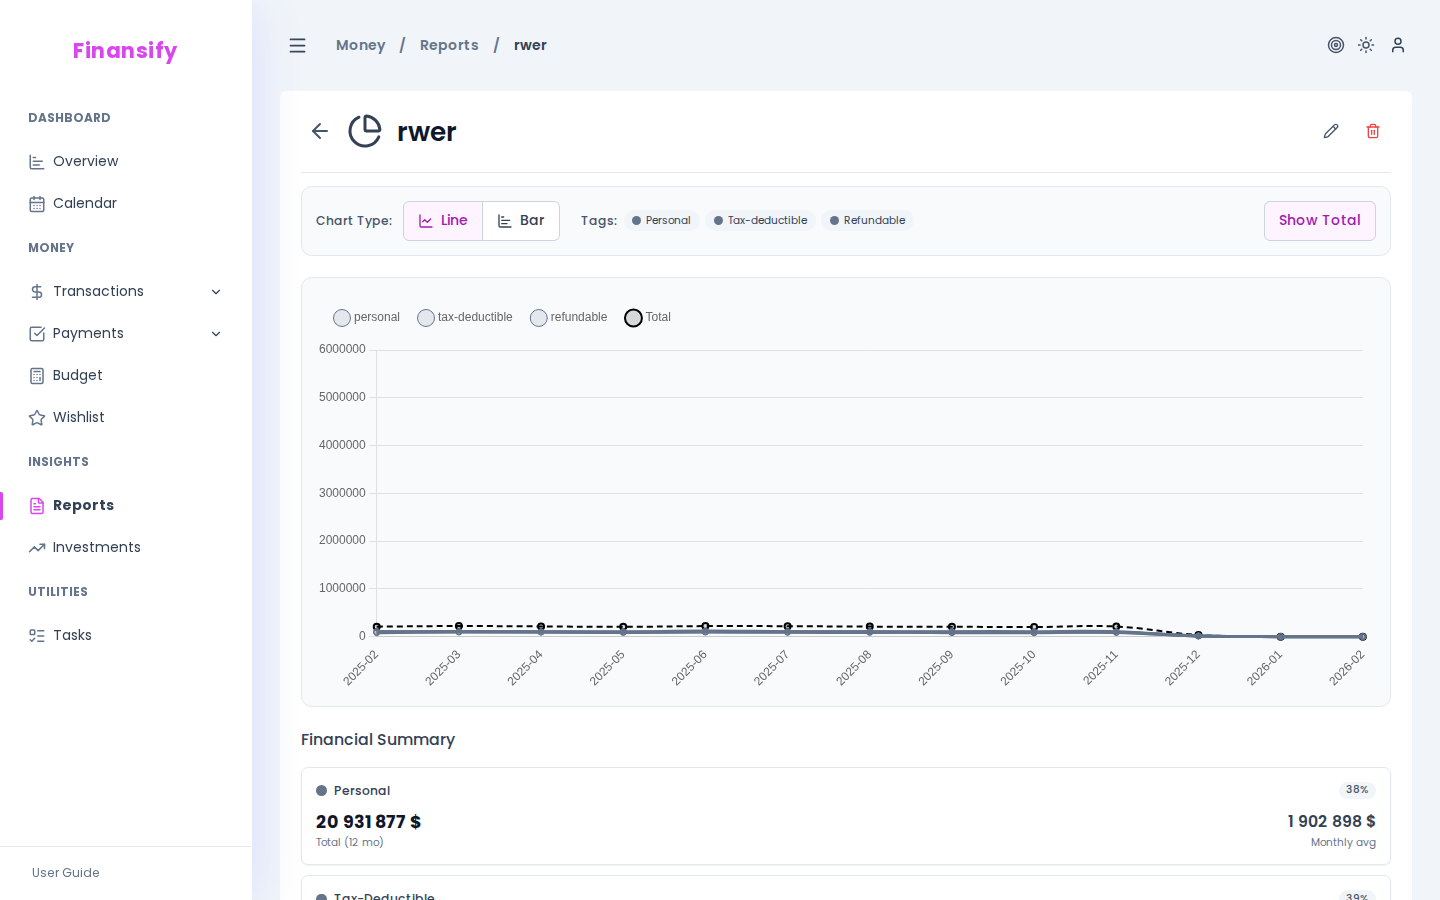
Report view
After opening a report you see:
Analytics chart
A chart (line or bar) showing spending over time — a separate line/bar for each tag group. The X axis is months, the Y axis is amounts.
Distribution chart
A percentage breakdown — what percentage of total spending falls on each tag group.
Summary
A table with numbers:
- Total amount for each group
- Monthly average
- Percentage share
 Report view
Tips
- Start with tagging — for reports to be meaningful, your transactions need to have the right tags. Add them regularly when creating or editing transactions.
- Tag groups != categories — a report can combine transactions from many categories if they share a common tag.
- Experiment with the period — 3 months will show short-term trends, 12 months — a yearly picture, 24 — long-term patterns.
See also:
- Transactions — tagging transactions
- Categories — the difference between categories and tags
- Subscription — reports are a Premium feature